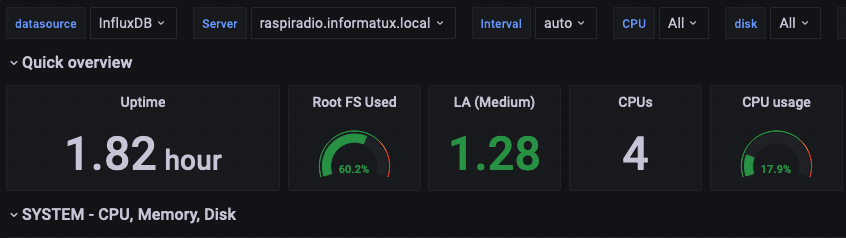
How to add a Grafana pre-built dashboard Once you have configured your Grafana + InfluxDB + Telegraf host and you have confirmed that you are sending data, the next step you want to perform is to create a dashboard to display it’s metrics. These are the steps that you’ll need to follow to install a pre-built Grafana dashboard. We will be using the dashboard listed here
First you need to go to