
How to add a Grafana Telegraf InfluxDB dashboard
How to add a Grafana pre-built dashboard
Once you have configured your Grafana + InfluxDB + Telegraf host and you have confirmed that you are sending data, the next step you want to perform is to create a dashboard to display it’s metrics. These are the steps that you’ll need to follow to install a pre-built Grafana dashboard. We will be using the dashboard listed here
First you need to go to
- Dashboards
- Browse
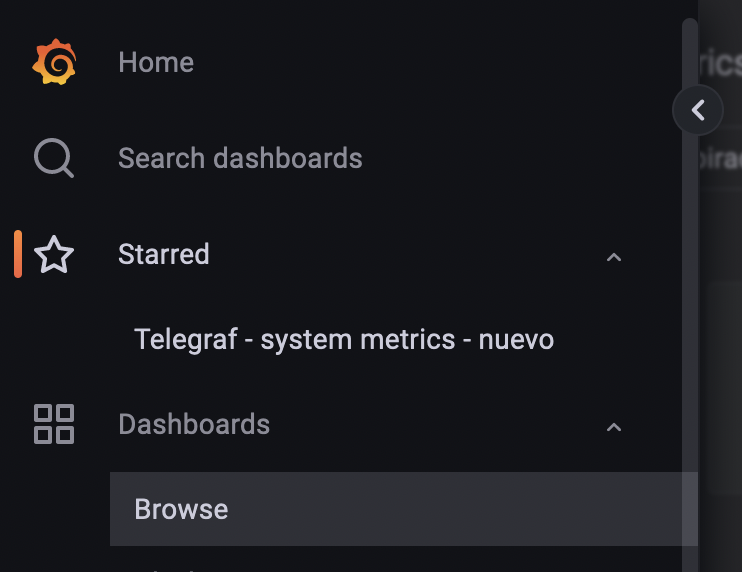
- Browse
In the following screen select
- New
- Import
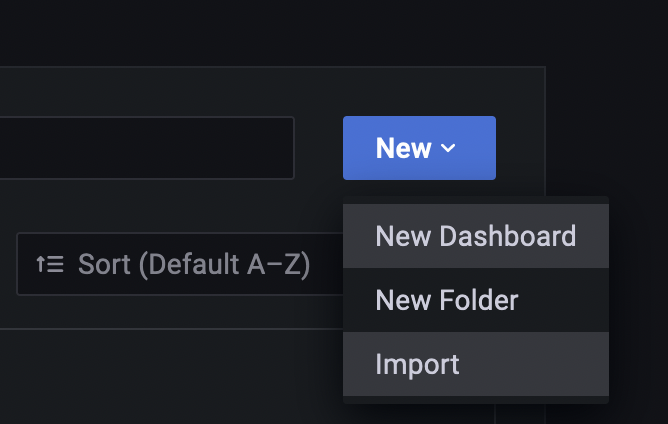
- Import
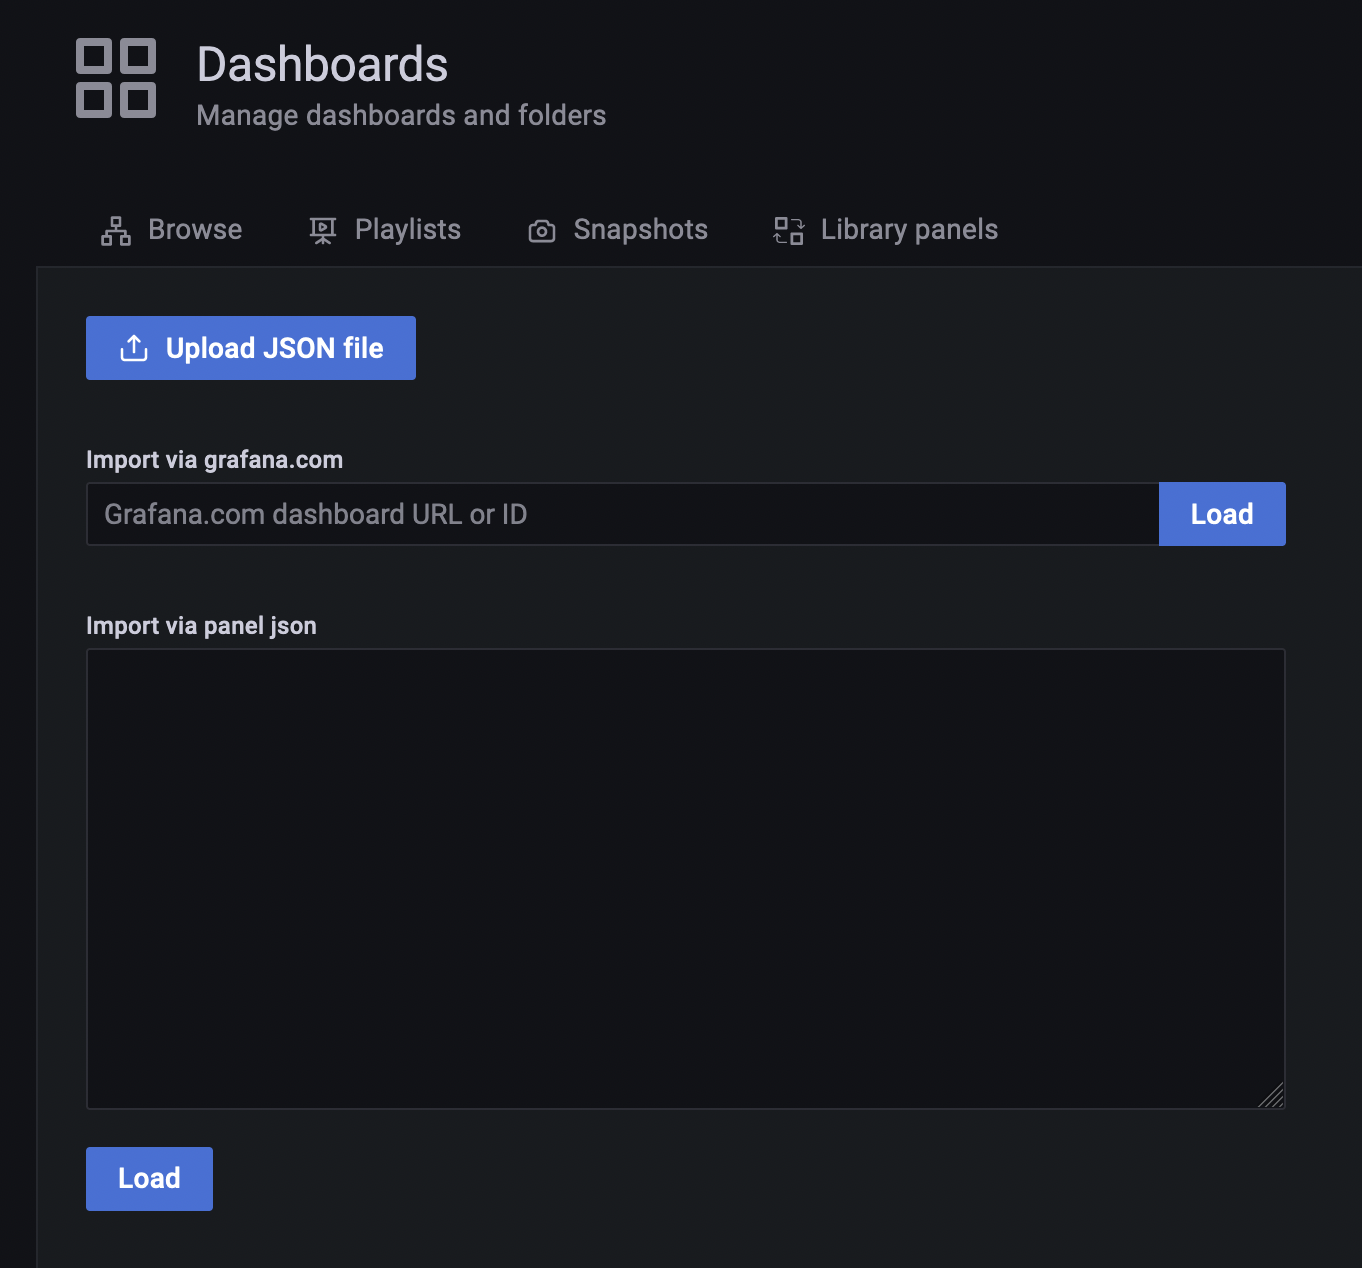
In the “Import via grafana.com” field enter the ID of the dashboard and select “Load”
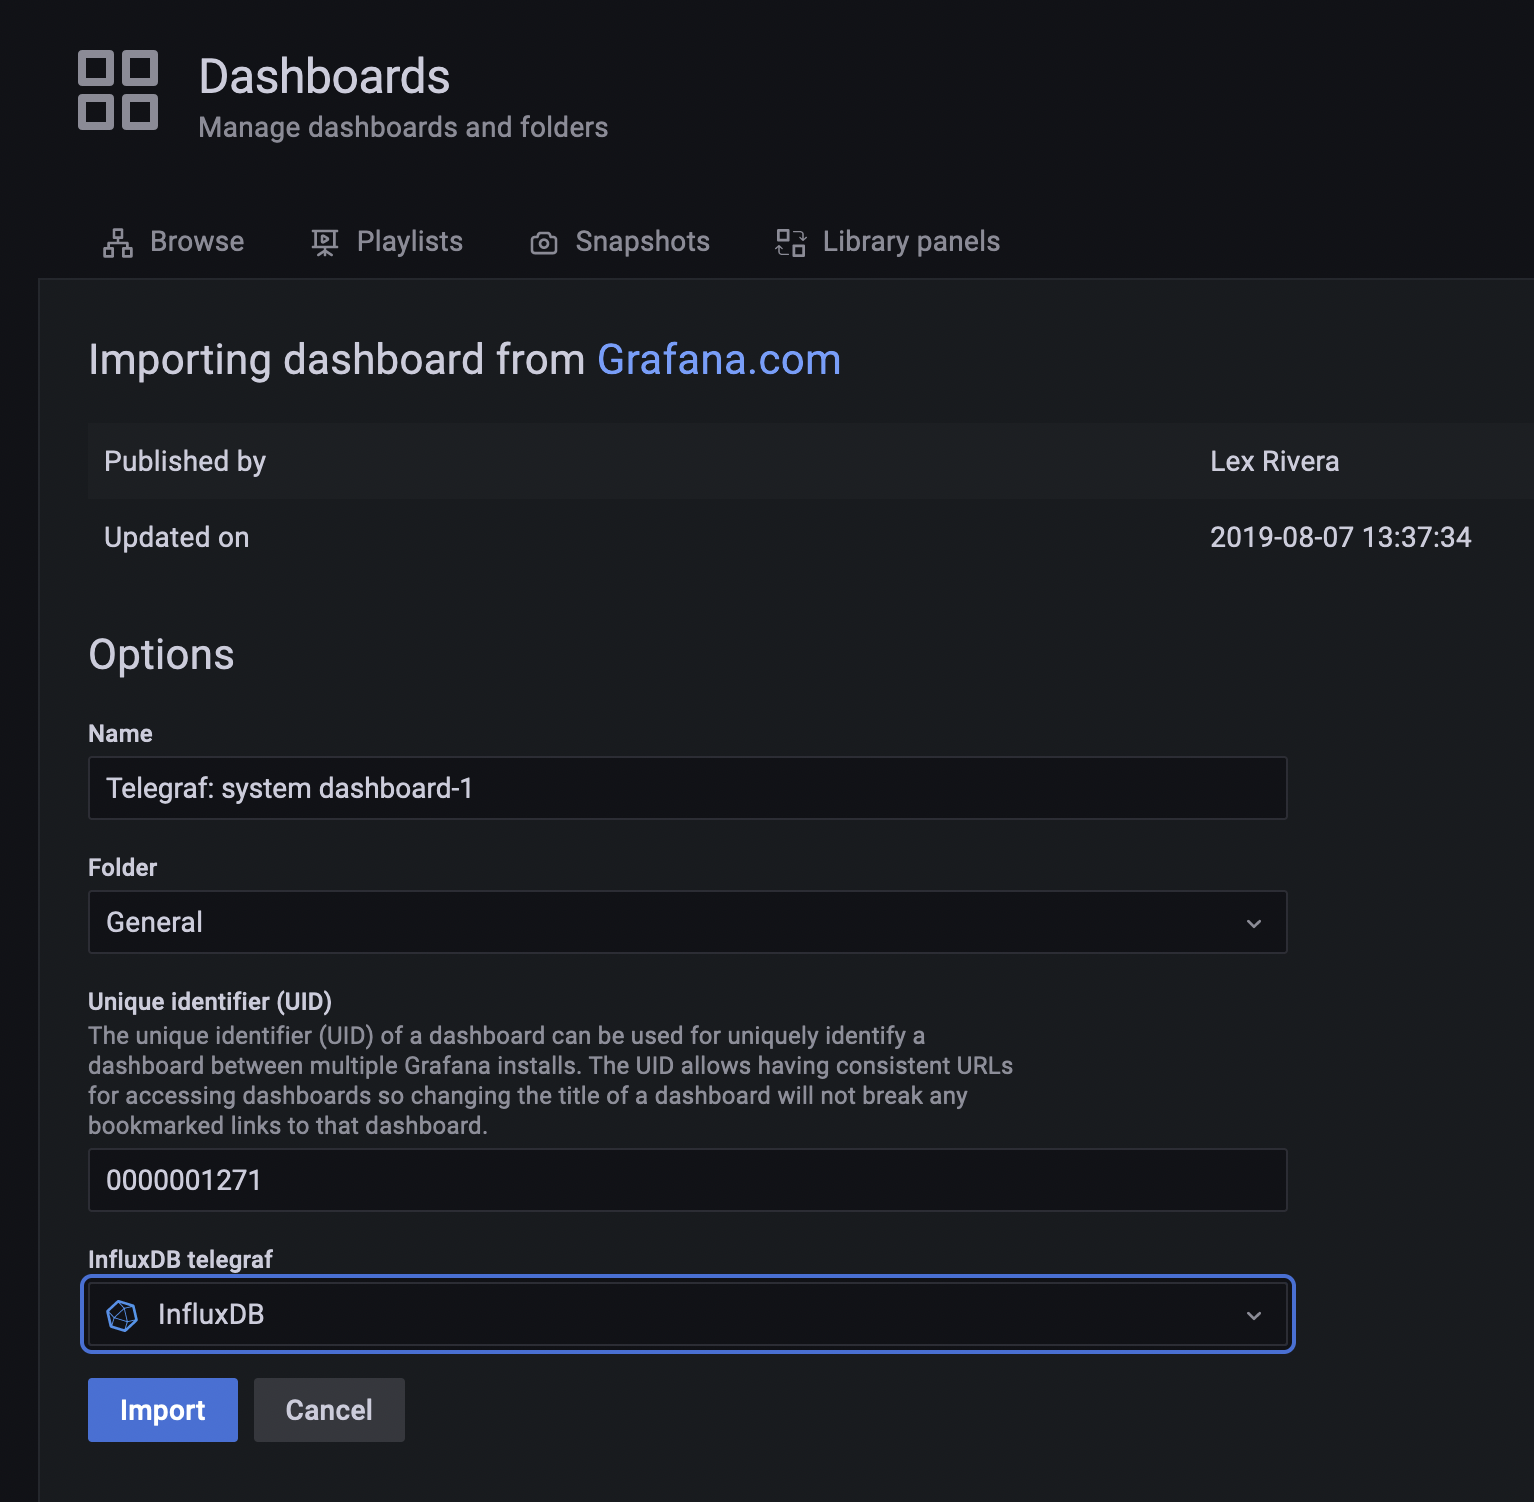
In the following screen select the InlufxDB database name:
And finally you will have in the dashboards list the recently imported dashboard.

